
Here is a chart detailing various fuel statistics for vehicles owned
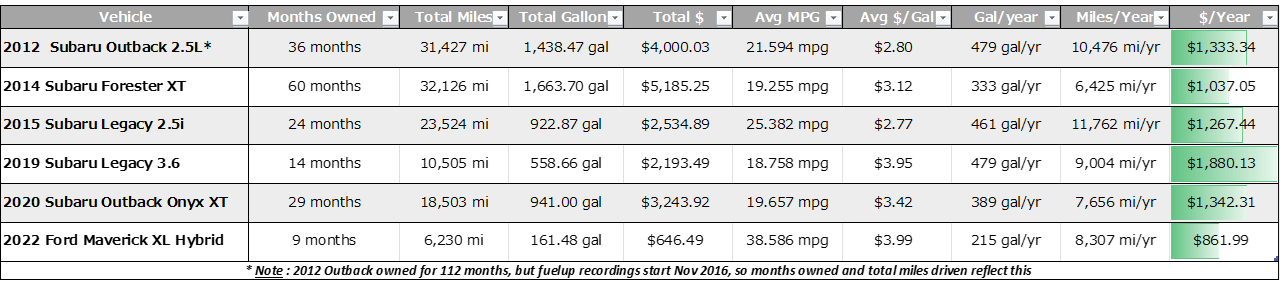
It is to be noted that the cars were driven different from each other. Also to be noted is that some of this data (miles, gallons, total $, average mpg, & average $/gal) was taken directly off the data collection app (same app for all cars), which accounts for some of the slight calculation disparity, but the right-most 3 columns are my own calculations.
The 2012 Outback 2.5i was the longest standing car at a total of 112 months owned, but recordings only started in 2016. It was driven mostly in routine commuting traffic in a city-driving environment.
The 2020 Outback XT was driven during pandemic times, used premium gas, and never took an extended highway trip. Traffic was nonexistent during pandemic time. Despite premium gas usage, price of gas was still cheaper than today’s more current gas prices. Driving statistics should have been much worse than it looks because I also drove this car very aggressively.
The 2022 Ford Maverick XL is the only hybrid powertrain here. With that, it shows a savings of $471.35 over the 2012 Outback 2.5i whose power statistics best match out of the group, as well as the type of traffic driven through and daily route. Now, if the average price of gas per year were matched (to the current $3.99) while keeping the gas consumption/year the same, then the disparity is $1911.21. Wow. That’s almost $2,000 in savings! Both in amount of gas consumption (479 gal vs. 215 gal — 44% decrease in amount used) per year and in dollars. $2k in my pocket…for frivolous things I don’t need.