written 06/10/23, updated 01/31/25
What
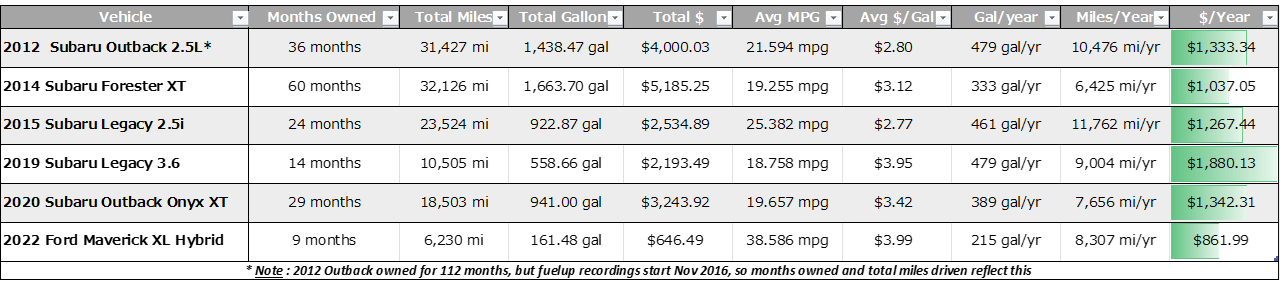
Fuelup comparisons among three vehicles owned by me for the duration of ownership: 2020 Subaru Outback XT Onyx Edition, 2022 Ford Maverick XL Hybrid, & 2023 Ford Mustang Mach‑E AWD Standard Range


Calculating: MPG/MPGe, Cost per Gallon of gasoline (or equivalent), and then by month to even the odds
Comparison Chart
| 2020 Outback (Gas) | 2022 Maverick (Hybrid) | 2023 Mach‑E (BEV) | |
| Time Owned | 29 months | 12 months | 23 months |
| Total Miles Driven | 18,503 mi | 8,051 mi | 15,0007 mi |
| Total Fuel Volume | 941.0 gal | 203.3 gal | 154.8 gal‑E* (5,216.2 kWh) |
| Total Fuel Cost | $3,243.92 | $774.93 | $1,229.31 |
| MPG/MPGe | 19.7 MPG | 39.6 MPG | 97 MPGe |
| Cost per Gallon (or kWh) | $3.45 | $3.81 | $0.24 |
| Miles Driven per Month | 638 mi | 670 mi | 653 mi |
| Fuel Volume per Month | 32.4 gal | 16.9 gal | 6.7 gal‑E (226.8 kWh) |
| Fuel Cost per Month | $111.86 | $64.58 | $53.54 |
| Total Maintenance Cost | $596.62 | $362.54 | $465.39 |
| Fun Cost (Additions) | $2623.03 | $2536.99 | $1032.88 |
Basic Vehicle Statistics
| 2020 Outback (Gas) | 2022 Maverick (Hybrid) | 2023 Mach‑E (BEV) | |
| Engine | 2.4L F‑4cyl Turbo CVT AWD | 2.5L I‑4cyl FHEV FWD | 1‑spd DD Electric AWD |
| HP | 260 hp @ 5,600 rpm | 162 hp @ 5,600 rpm* | 266 hp |
| Torque | 277 lb-ft @ 2,000 rpm | 155 lb-ft @ 4,000 rpm | 428 lb-ft |
| Fuel Capacity | 18.5 gal | 13.8 gal | 70kWh |
| Fuel Economy (city/hwy/comb) | 23/30/26 | 42/33/37 | 99/86/93 |
| Range (EPA) | 481 mi | 511 mi | 224 mi |
| Weight | 3,884 lb | 3,674 lb | 4,498 lb |
| Wheelbase | 108.1 in | 121.1 in | 117.5 in |
| Length | 191.3 in | 199.7 in | 185.6 in |
| Width (with mirror) | 82.0 in | 83.5 in | 74.1 in |
| Height | 66.4 in | 68.7 in | 64.0 in |
| Tow Rating | 3,500 lb | 2,000 lb | - |
Analysis
Easy to see that the data favors electrified vehicles: cheaper, less fuel consumed, better MPGs
Cost per gallon of gas (or equivalent) goes increases the more electrified the vehicle. Keep in mind, overall cost is less
Maintenace costs decrease with increased electrification. However, both electrified vehicles were owned for less time than the gasoline car